Always innovating and improving our service, we’ve been developing a custom dashboard for our clients these last few weeks.
It’s finally in beta release!
The dashboard is designed to show a top down view of key site metrics, including:
- Performance stats,
- Site analytics,
- Uptime figures,
- Recent posts & pages,
- General info such the php & WP core version.
We share some of this information already via our monthly care report for our maintenance and managed hosting clients. However, we wanted to make this information accessible 24/7, hence the dashboard creation.
Anyway, without further a-do, here’s a sneak peak.
Dashboard home
Nothing too glamorous, just some key info and a screenshot of the client’s website’s homepage.
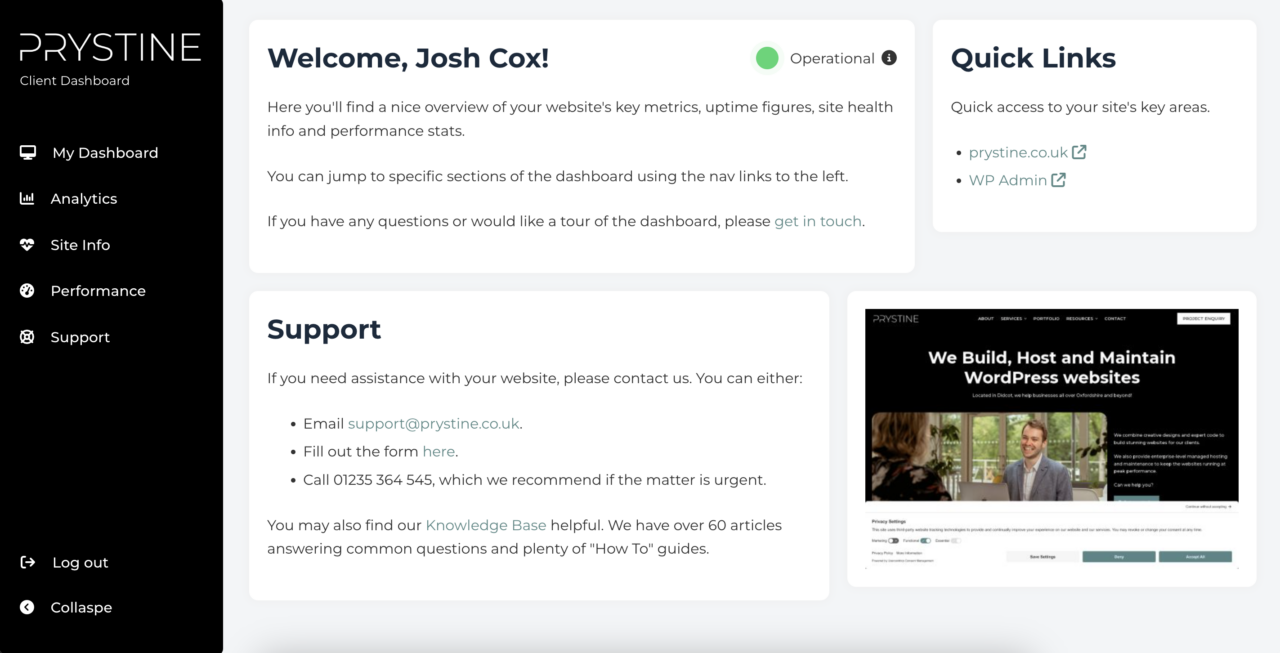
My Dashboard tab
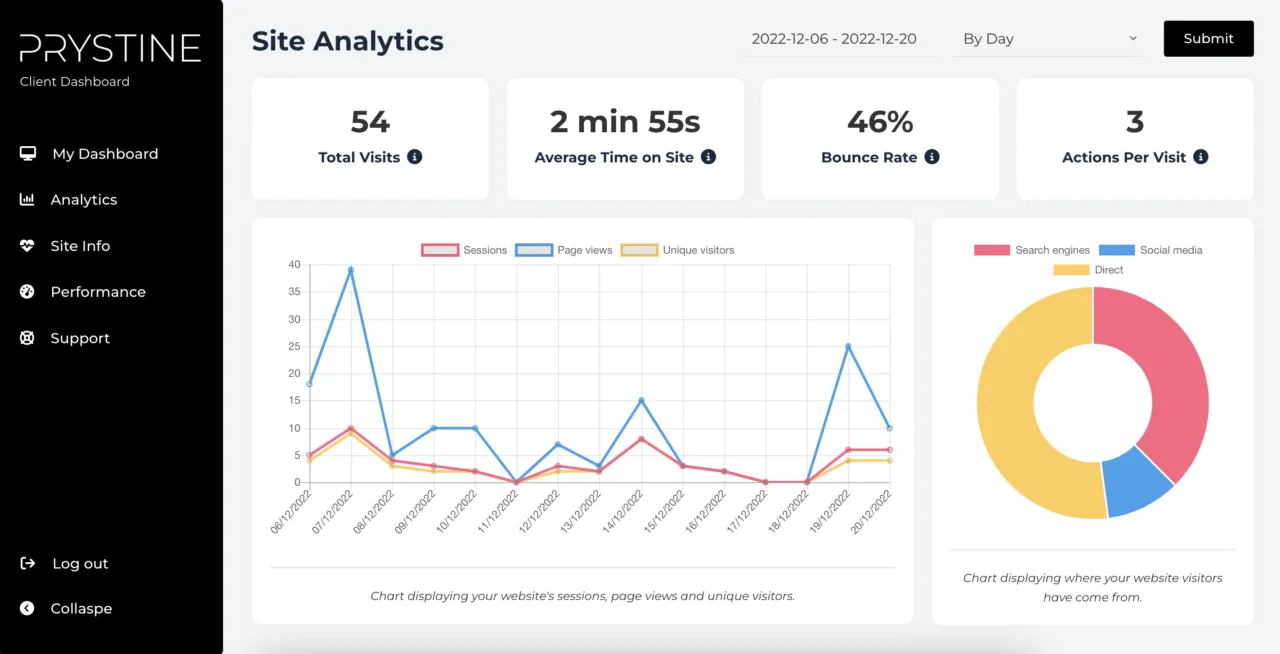
Site analytics
A nice and concise overview of the website’s key stats. There’s an option to filter by date range and look at the data either by day or by week. The charts are interactive, meaning you can hide lines and sections as needed.

Analytics tab
Site performance
Using the power of Google Lighthouse, we analyse the client’s website in real time and share key stats bench marked against the ‘average’ website.
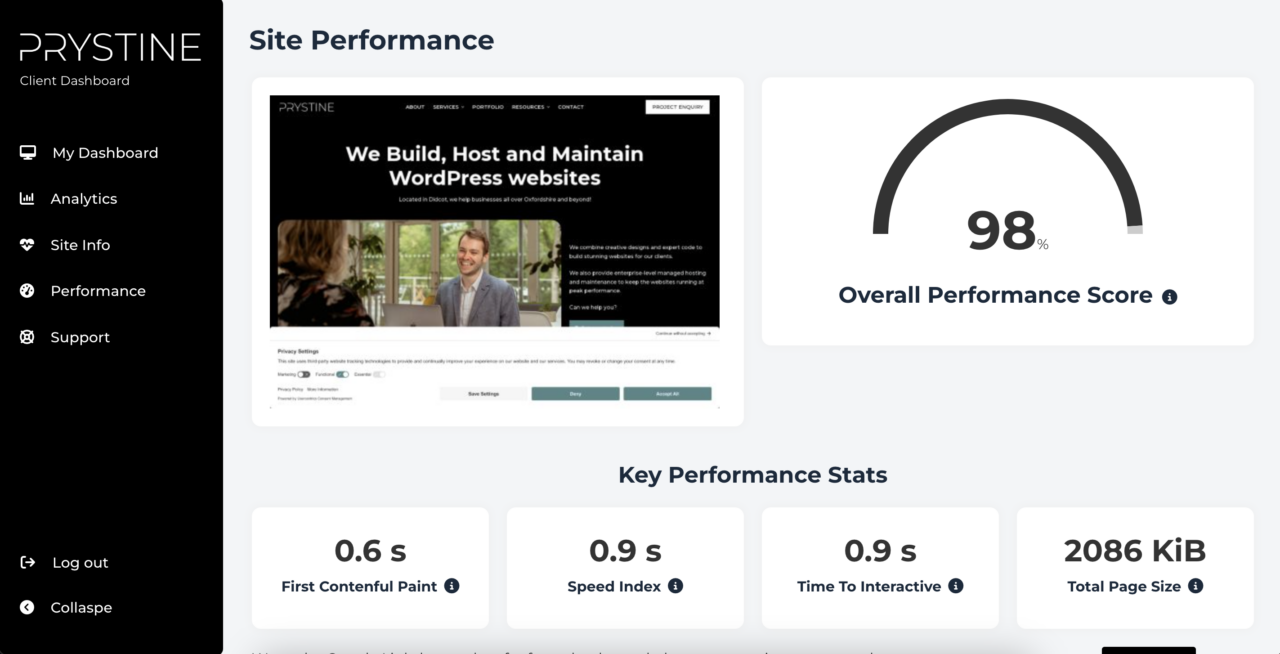
Performance tab
Site Info
On this tab, you can see your most recent pages, posts, uptime stats and key health info.
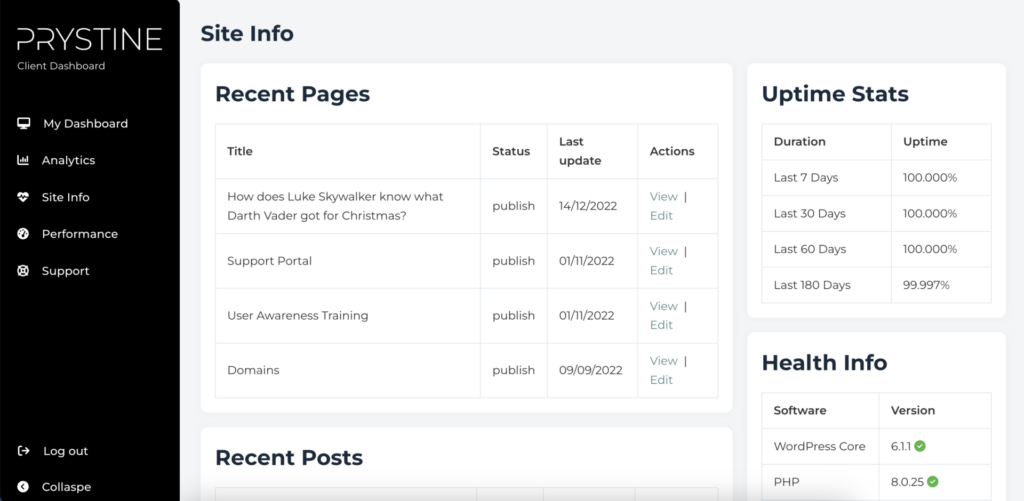
Site info tab
Accessing the dashboard
You can view the front page of our dashboard here, although currently it’s just a holding page and you won’t be able to see anything without access.
If you’re interested in seeing a demo, speak to us. However, for access, currently whilst it’s in its beta stage, we’re only opening the dashboard to select existing clients.

Josh Cox
I'm Josh — I build, host and look after WordPress sites (and increasingly fast Astro / Next.js builds) for Oxfordshire businesses, from Didcot, since 2016. I also tinker with a few products of my own on the side.